This is a story about how my band Smalltown Poets used artist data to leverage success for our music.
Over the course of five days, a simple video post on Facebook netted us over 55,000 views, 806 shares, 500 new followers, 150 song downloads, 20 album downloads, and thousands of streams on Spotify and Apple Music. It was so simple! There was no big marketing plan or time spent brainstorming an idea. All it took was paying attention to the data and understanding what hidden opportunities it was pointing to.
Follow Smalltown Poets on Spotify HERE and Apple Music HERE.
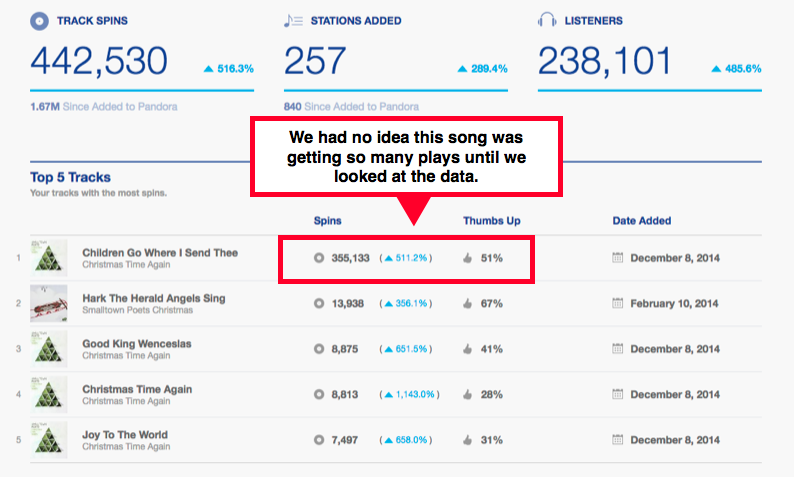
We noticed a particular song was very popular on Pandora
The song is our a cappella version of a traditional song called “Children Go Where I Send Thee.” The song was not one of our “hits” or what we would have considered to be one of the more popular tracks from our Christmas catalog (we’re a rock band after all), but for some reason, two years in a row at Christmas time it has seen a large amount of spins on Pandora.

We had a decent live video from a recent performance and thought, judging from the Pandora data, that posting it to Facebook could do well.
The video started getting shared very quickly. Within a couple hours we were pushing 100 shares. At the time of posting the video, we had 5,200 Facebook followers, so when looking at the “organic reach” number provided by Facebook, it was clear that this was spreading beyond our network. This was something that people saw and wanted to share.
Things we did to try to increase the velocity of sharing.
Asked our personal networks to share – Since we knew we were on to something, we immediately made sure everyone in the band had shared it with their personal networks. This seemed to give it a momentum push as people close to the band started sharing it at a high frequency.
Emailed our fan list – We asked everyone on our email list to check out the video and help us keep it rolling with a share. That definitely added another wave of “sharing” momentum.
Bought Facebook ads – Still looking for something that would really cause the dam to break and take the sharing to a whole new level, we bought Facebook ads. These were a disappointment. I started out by spending $20 (which isn’t much), but wanted to test the waters to make sure the money was going to be well spent. It took Facebook about 3 days to burn through the $20. In the end, the post had an organic reach of 119,000 people while the ad only reached an additional 10,000 people.
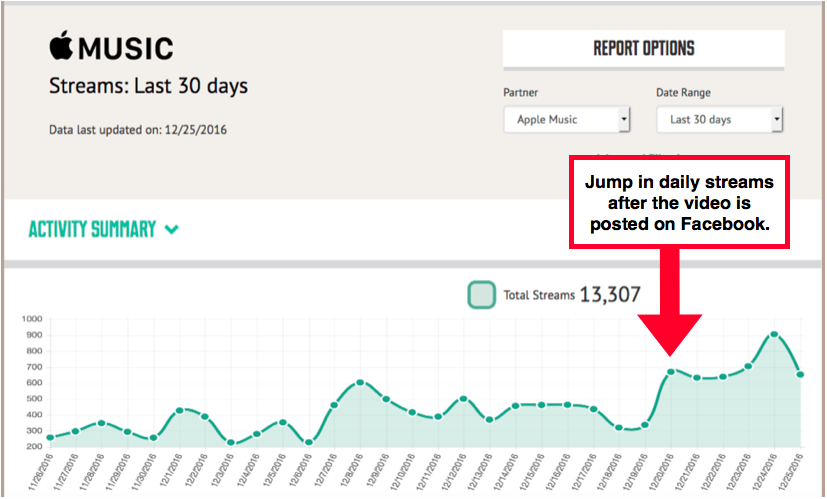
Using CD Baby Trending Reports, we were able to see the direct results of the viewing and sharing activity.

Apple Music and Spotify links were included in the post, and I also responded individually to questions about where the music was available. Apple Music and iTunes have a very nice widget that allowed fans to listen right from the comment section. It really drove Apple Music streams and iTunes downloads.
The things we missed that we should have done from the start
Embed the same video on our website – Since the video was posted directly to Facebook, we forgot about putting it on our website until a couple days later. Facebook has come a long way with their video platform, so embedding a video in your artist website is as easy as embedding a YouTube video.
Having “buy” links on the post from the beginning – We were unsure if having “buy” links right on top of the video would hinder the share-ability of the post, so we opted not to put them there at the start. However, the way Facebook formats video posts, the text for the “post” section is pretty much hidden. Posts can be edited though, so once we added the buy links into the original post and into the comments, it was obvious that people were buying — and the addition of those URLs didn’t seem to hurt the video’s organic reach.
Why we think it was shared so much.
- A cappella songs are big right now, especially at Christmas time, so I’m sure that is partly why this song is seeing some success.
- The video has a very nice audio/video quality with real humans singing (no auto-tune).
- No fluff or extra stuff on the video. The song starts right from the beginning and there is no graphics to distract or make it feel like an ad.
- It has a nice energy/movement that catches the eye when scrolling through your Facebook feed.
If it was being shared so much, why only 50,000 views? Why not 1,000,000?
- The song is a Christmas song. From the time we posted it, we had one week until Christmas day (when Christmas music listening drops like a rock).
- The video has no cats or silly animals. Seriously though, look at your Facebook feed and see how many of the popular videos have those elements.
- Nothing unexpected happens in the video. There is no surprise ending where someone falls off the stage. There’s no “you won’t believe what happens at the end” moment.
- Our initial Facebook network was small. If our Facebook network has been larger, the chances of spreading further would have increased exponentially.
- We didn’t get any big influencers to share the video with their network. This was where the Christmas timeline became a challenge. Not only was there little time to reach out to folks with large networks, but most of them we knew were already heading out for vacation.
Questions to ask yourself about your own artist data
- What am I seeing that I DID expect to see?
- What am I seeing that I did NOT expect?
- Is there success happening on (or maybe even limited to) a particular platform?
- How can I use this information to add value to my fans?
This minor video success happened because I was paying attention to the data, noticed something I hadn’t expected about our song catalog, and delivered to our fans something we hadn’t previously known they wanted. It’s not rocket science; you just have to make a habit of looking at your analytics and trending reports in CD Baby, Pandora, and elsewhere.
This article was found on hypebot.com


