Once again, yearly vinyl album sales have hit another Nielsen Music-era record high, as the configuration sold 14.32 million (up 9 percent) in 2017. That’s up from the previous one-year high, registered in 2016 with 13.1 million.
Nielsen Music’s 2017 tracking year ran from Dec. 30, 2016 through Dec. 28, 2017. Numbers in this story are rounded. Nielsen Music began electronically tracking music sales and data in 1991 (so a reference in this story to the “Nielsen era” means from 1991 to the present).
2017 marks the 12th straight year of growth in vinyl album sales. The format continues to increase in sales as more new and classic albums are issued on vinyl, promotion from retailers like Amazon, Urban Outfitters and Barnes & Noble, as well as annual vinyl-oriented celebrations like Record Store Day.
Vinyl LP sales represented 8.5 percent of all album sales in 2017 – up from 6.5 percent for the configuration’s share in 2016. Further, LP sales were 14 percent of all physical album sales in 2017 (a Nielsen-era record share for the format) – up from 11 percent in 2016.
Further, vinyl album sales were driven by an array of titles, not just a handful of hot sellers. In total, 77 different titles each sold more than 20,000 copies on vinyl LP in 2017, as compared to 58 in 2016.
As usual, rock music, by far, drives most vinyl album sales, as the genre accounted for 67 percent of all vinyl album sales in 2017 (versus 69 percent in 2016).
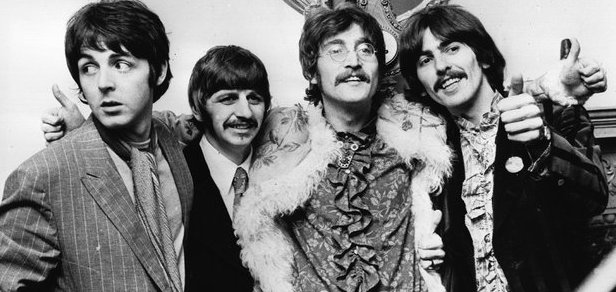
The Beatles finish 2017 with the top two selling vinyl LPs of the year: Sgt. Pepper’s Lonely Hearts Club Band (72,000 — powered in large part by the album’s deluxe anniversary reissue in 2017) and Abbey Road (66,000). The soundtrack Guardians of the Galaxy: Awesome Mix Vol. 1 is the third biggest with 62,000. Comparably, in 2016, the top three sellers were Twenty One Pilots’ Blurryface (68,000), David Bowie’s Blackstar (66,000) and Adele’s 25 (58,000).
| TOP 10 SELLING VINYL ALBUMS OF 2017 IN U.S. | |||
| Rank | Artist, Title | Sales | |
| 1 | The Beatles, Sgt. Pepper’s Lonely Hearts Club Band | 72,000 | |
| 2 | The Beatles, Abbey Road | 66,000 | |
| 3 | Soundtrack, Guardians of the Galaxy: Awesome Mix Vol. 1 | 62,000 | |
| 4 | Ed Sheeran, ÷ (Divide) | 62,000 | |
| 5 | Amy Winehouse, Back to Black | 58,000 | |
| 6 | Prince and the Revolution, Purple Rain (Soundtrack) | 58,000 | |
| 7 | Bob Marley and The Wailers, Legend: The Best Of… | 49,000 | |
| 8 | Pink Floyd, The Dark Side of the Moon | 54,000 | |
| 9 | Soundtrack, La La Land | 49,000 | |
| 10 | Michael Jackson, Thriller | 49,000 | |
| Source: Nielsen Music, for the tracking period Dec. 30, 2016 through Dec. 28, 2017. | |||
Originally posted on BILLBOARD.COM


